Chris Gleason: Why build a renewable energy dashboard?

EDITOR’S NOTE: At a ceremony this spring, the Greenhills Renewable Energy Dashboard was formally renamed the Gleason Renewable Energy Dashboard, in appreciation for the countless hours Chris and Jim Gleason have dedicated to its development over the last three years. Here is a blog about how—and why—they did it.
Greenhills made a commitment years ago to be a “green school.” We strive to educate, excite and encourage our students to be responsible citizens of the world. We educate them to make informed choices not only for themselves now, but also for future generations. If our earth is to continue to sustain life for centuries to come, we have to understand what impact each of us has and what we can do to ensure a sustainable future.
In order to understand one aspect of global sustainability, students need to explore options we have for renewable energy generation. With this goal in mind, the Class of 2007, as their senior gift, donated the funds to purchase and install a rooftop wind turbine. And over the last three years, my husband Jim (an engineer) and I have led development of the Greenhills Renewable Energy Dashboard to display and store real-time data from the turbine.
Additionally, a small five-watt solar array, a weather station (donated by a Greenhills parent) and temperature probes comparing the temperatures of our standard roof and our plant-covered “green roof” have been added to the display.
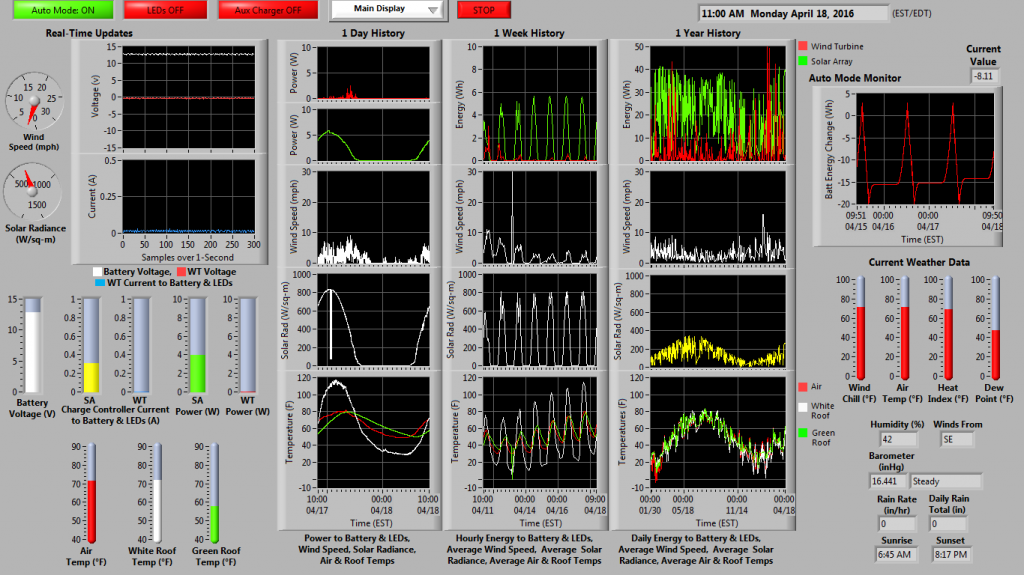
The GRED measures and displays environmental (wind speed, solar radiance, etc.) and electrical (voltage, current, power, energy) parameters and archives the data to quantify the performance of the school’s wind turbine, solar array, and green roof. The constituent hardware is displayed for viewing, and the performance data from multiple renewable energy resources is archived for use in middle school and high school student education.
At the National Science Teachers Association Conference in April, Jim and I presented the “Greenhills Renewable Energy Dashboard for Student Education.” Here is a link to a video we posted with a narrative of the presentation.
At the heart of the GRED is a glass display cabinet where students can view the basic components that power two five-watt LEDs that help illuminate the forum where the display is located. The cabinet also allows students to see the dashboard performance monitoring components, including voltage sensors, current sensors, a console that receives data from the rooftop weather station, analog-to-digital computer interfaces, and control relays. Custom software generates voltage, current, power, energy, rooftop temperature and weather statistics over time and displays real-time results and longer-term correlations (such as wind speed versus wind turbine power and solar radiance versus solar array power) on a 50-inch TV monitor. Posters provide details on renewable energy resources, monitoring components, and the display results.
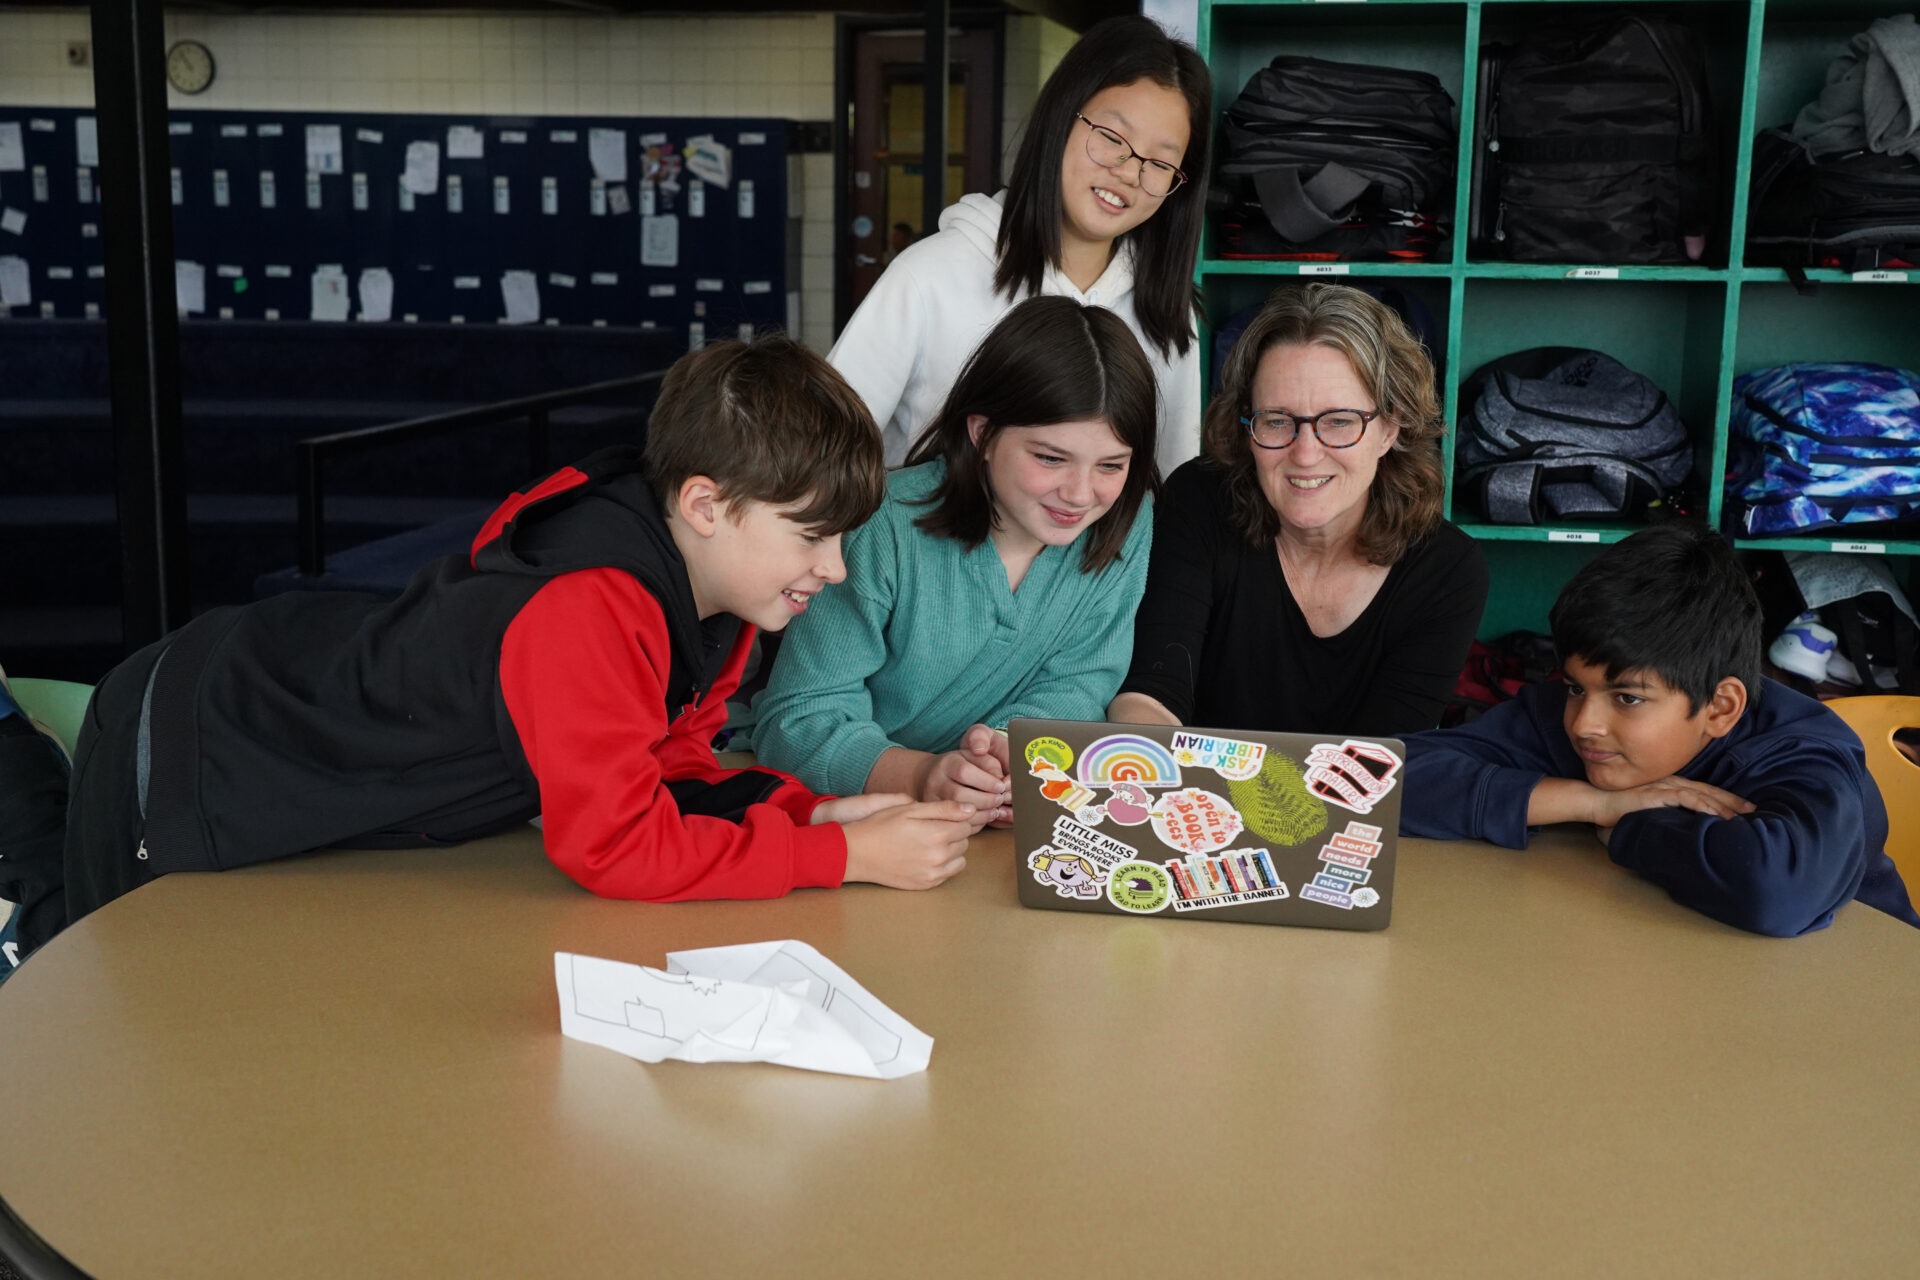
The system is a one-of-a-kind resource for our students’ education, offering lessons related to sustainability, engineering, and data interpretation and analysis. To date, GRED has been used in eighth-grade science and math grade classes and chemistry and high school science classes. It has also been explored in more detail by eighth-grade student groups exploring the merits of wind versus solar energy as part of the eighth grade Sustainability Action Project that runs concurrently with the eighth grade energy science curriculum. The science and math departments are meeting to learn how to further use GRED to its fullest potential in our classroom instruction.
Next step: sharing the benefits of GRED with other educators in our region!
—Christine Gleason, retired Greenhills science teacher


